Archive
Future Tidal Wave of Mobile Video
Analysing Mobile Internet Video Trends 2015-2020
In this article I will examine the growing trends of Internet Mobile video and how consumer behaviour is rapidly adopting to a world of ‘always on content’ and discuss the impact on the underlying infrastructure. This is very important because we often assume that the Internet has infinite capacity and we can get frustrated by buffering, which wouldn’t happen with our satellite and terrestrial TV services.
This pattern also follows other observed trends in social media, namely Twitter, Facebook and Instagram, which provide consumers and producers with a highly valuable return path on the content, that they’re engaged with. It’s also a double edged sword in what they can provide is both positive and negative feedback, this can affect the brand in unexpected ways.
The source of this analysis comes from Cisco’s excellent Visual Networking Index, updated annually, which tracks the growing usage patterns across mobile and non-mobile devices. When I wrote this in May 2016, the most recent mobile data was from February 2016. The figures below are Cisco VNI projections published in 2016 for the 2015–2020 period, not current forecasts. At the time they made a compelling argument for anyone involved in providing video services to review infrastructure hardware and software stacks. As customers’ expectations had changed over the preceding years, the outlook then was to prepare for roughly 50–100% traffic growth every year for the next 4–5 years.
Also published
- Published under my byline on High Scalability (20 October 2016).
- Included in StatusCode Weekly Issue 89 (26 October 2016).
- Chinese translation on InfoQ China (25 December 2016).
Population Growth
According to the US Census Bureau the world population will reach 8 Billion by 2025 and by 2020 there will be up to 5.5 billion mobile users across the globe. If we take a closer look at the individual regions, we can observe that the fastest growing location will be in Asia Pacific.
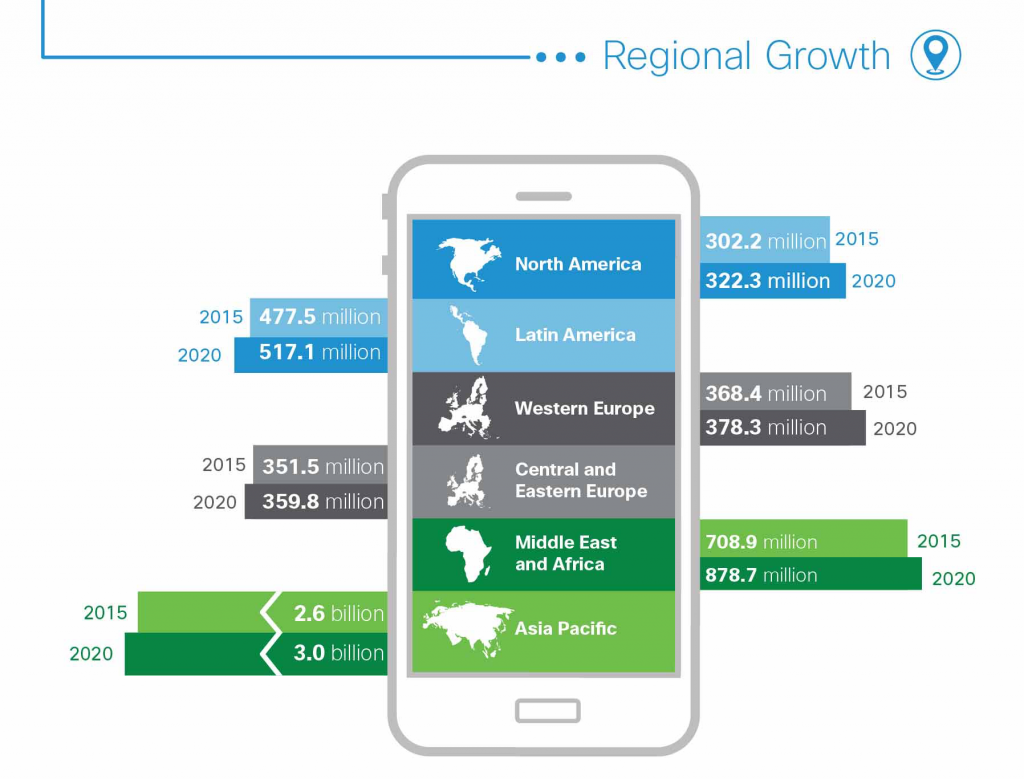
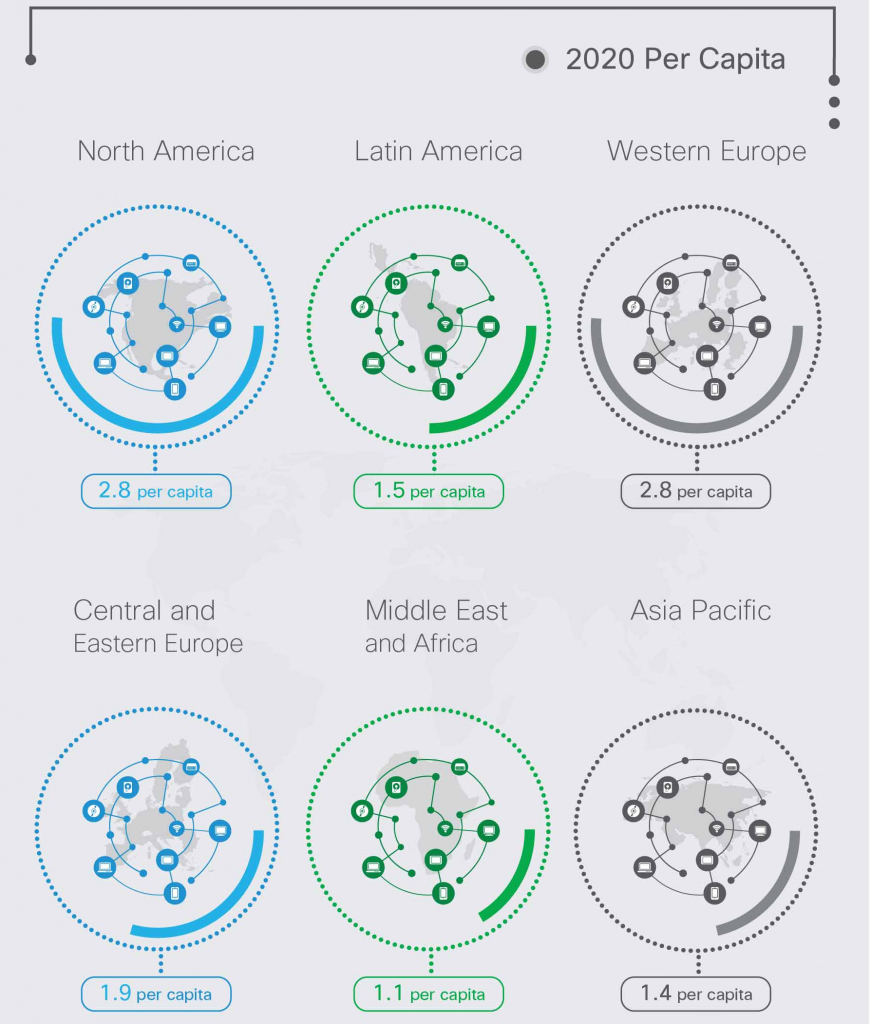
The data shows where the global opportunity lies, with up to 2.8 devices per capita in developed countries and over 1 elsewhere, which is provable in our modern connected world where your phone is the one device that you are never without.
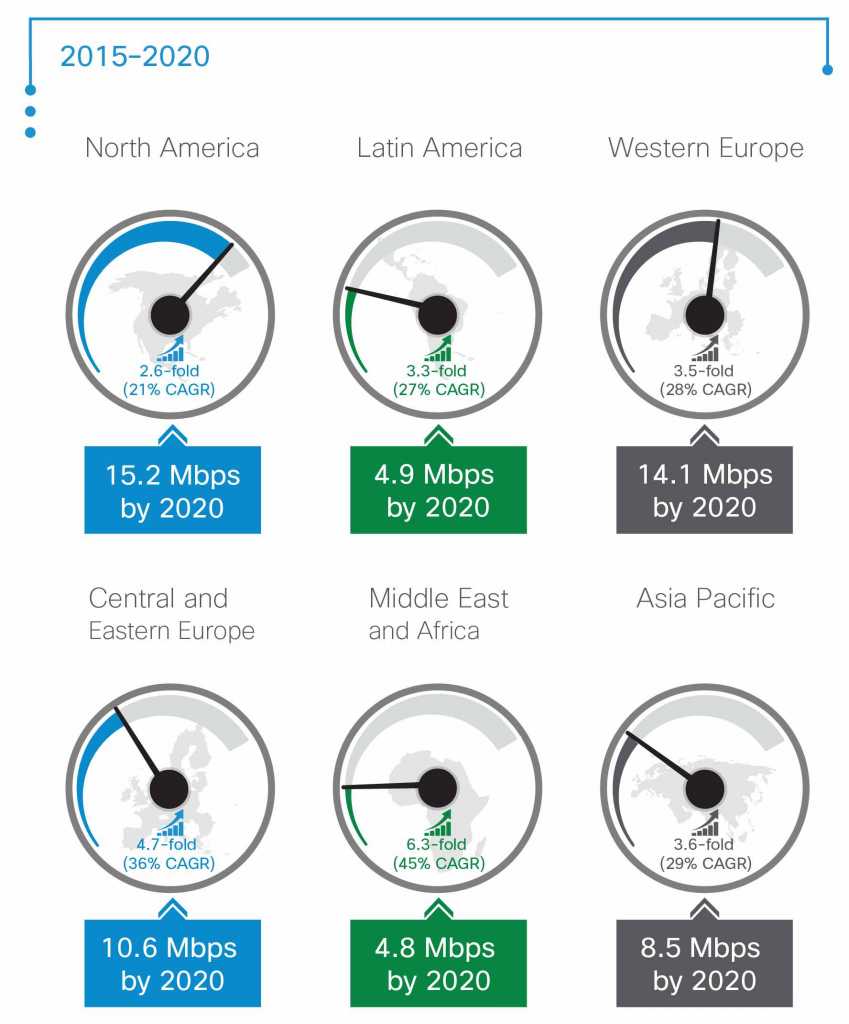
Average Mobile Connection Speed Growth
With rising population affecting the growth of consumer devices, we have a correlation in average mobile connection speeds. As mobile providers continue to build out their networks for 4G it is probable that this will be the standard by 2020. We may also see some limited 5G services by the end of the decade, with its promise of 3-4x speed improvements in urban areas.
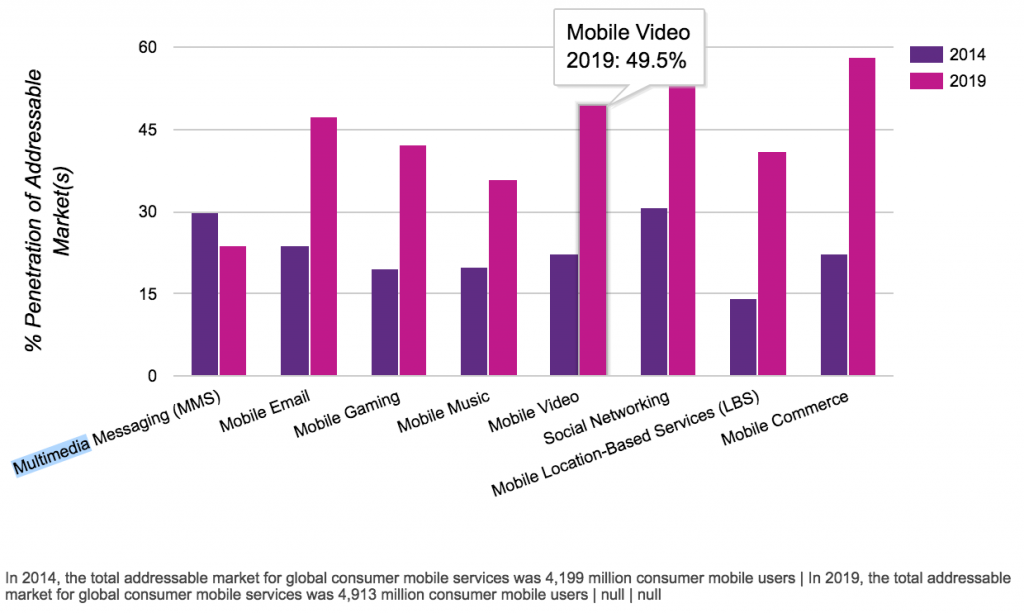
Mobile Market Penetration
The global growth in Mobile video service penetration, with almost 50% of consumers expected to consume online video on a daily basis; determines the number of mobile devices, which is increasing rapidly. In some countries it is the only means consumers have of accessing the Internet and video. We also observe the large growth in mobile commerce, as companies take advantage of consumers’ willingness to be marketed to directly, and their desire to be engaged with brands. See chart below.
Mobile Video Global Data Traffic
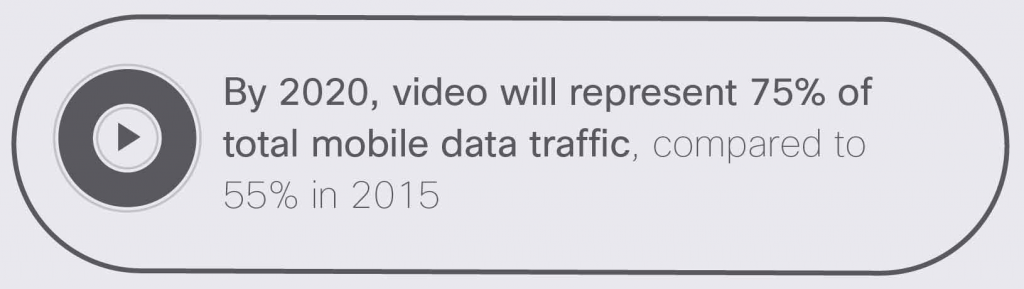
A key finding of Cisco’s 2016 forecast for global mobile video showed traffic’s share of mobile data increasing from 55% to 75% by 2020, alongside the population and speed trends above. Non-mobile video traffic was expected to reach about 80% by 2020, which supported the observation that Internet infrastructure would need to scale for this oncoming demand.
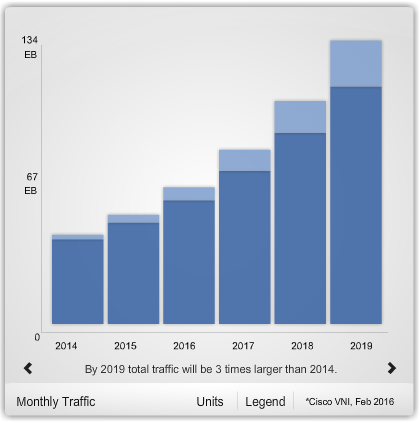
The frightening statistics of this next graph particularly for an ISP or Telco, are because it shows the quantity of Internet video in Exabytes, with mobile shown in light blue and non-mobile in dark blue. In the world of Mobile Network Operators or MNO’s, one thing that will have to evolve is the consumer billing model. ‘Passed voice’ revenue is out of date, with the majority of consumer billing being for data services, with the trend of consumer video MNO’s needing to have much more flexible pricing plans, to attract customers and reduce churn.
In Summary
If you’re involved in providing consumer video services over the Internet, you may want to consider your approach to changes in consumer behaviour and in particular the flash crowd problem, typically peaking for example, during sporting events. One common approach is to use a Content Delivery Network or CDN to offload the peak crowds but even then you may need to consider multiple CDN’s to avoid single points of failure.
Something to consider!
Jeff
Source: Cisco Visual Networking Index and US Census Bureau (Census chart link as cited in 2016 no longer resolves).